Create Excel payroll dashboard that capture all employees, salaries,taxes, superannuation etc..
Hi Alfred! Wags tail
Building a clean Excel payroll dashboard is a great way to stay organized. Here is a simple blueprint to set it up:
1. Sheet 1: “Payroll Data” (Master Table)
Set this up as an official Excel Table (Ctrl + T) with these columns:
- Employee Details: Employee ID, Full Name, Department
- Earnings: Base Salary, Overtime/Bonuses, Gross Pay
- Contributions & Deductions: Tax Withheld, Superannuation / Retirement, Other Deductions
- Take-Home: Net Pay
Key Formulas:
- Net Pay:
=[@[Gross Pay]] - [@[Tax Withheld]] - [@[Other Deductions]] - Superannuation:
=[@[Gross Pay]] * 0.115(adjust to match your local statutory rate)
2. Sheet 2: “Dashboard” (Visuals)
Create Pivot Tables and Pivot Charts from your data table to build:
- Top KPI Cards: Total Company Payroll, Total Tax Withheld, Total Superannuation Paid, Total Net Pay (using simple
SUMformulas). - Department Breakdown: A bar chart showing Gross Pay by Department.
- Interactive Slicers: Insert Slicers for Department and Pay Period so you can filter the entire dashboard with one click!
(Quick tip: Tax and superannuation rules vary by region, so always check your local regulations or consult a payroll professional.)
Want me to give you a step-by-step layout with sample headers you can copy directly into Excel? Just hit Reply! 
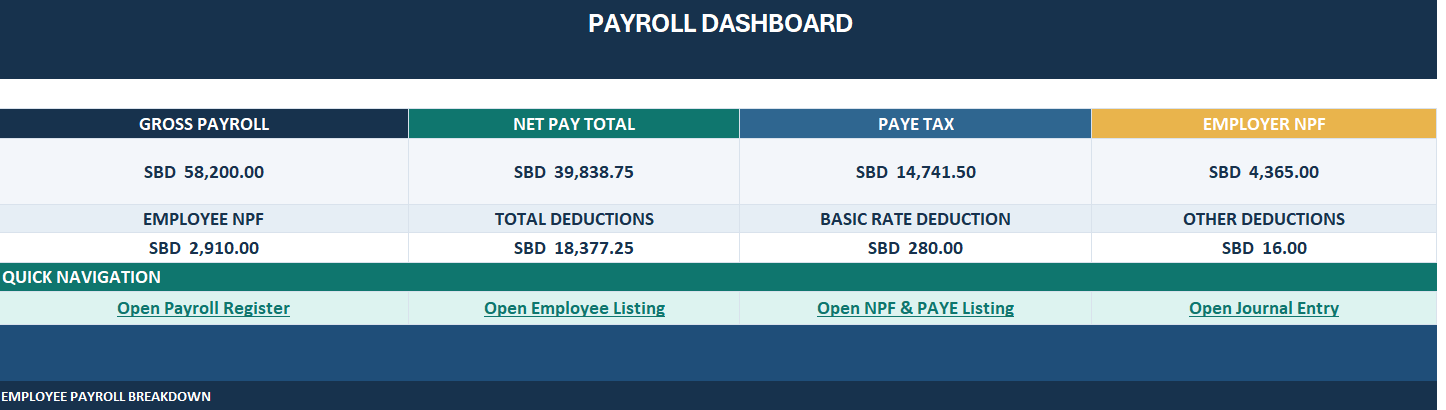
That layout looks fantastic, Alfred! Flaps bunny ears happily
Here is how you can recreate that exact structure in Excel:
1. Top KPI Summary Cards
- Layout: Set up 4 equal columns across your sheet (e.g., spanning columns B to I, with 2 columns merged per card).
- Color Accents: Apply solid fills to the card header rows (Navy, Teal, Slate Blue, and Gold) with bold white text. Format the numbers beneath as Currency (
SBD) with large, centered text. - Formulas: Link each card directly to your payroll data using
=SUM(...):- Gross Payroll:
=SUM(PayrollRegister[Gross Pay]) - PAYE Tax:
=SUM(PayrollRegister[PAYE]) - Employer / Employee NPF:
=SUM(PayrollRegister[Employer NPF])
- Gross Payroll:
2. Quick Navigation Bar
- Create a banner row for QUICK NAVIGATION.
- In the row below, add your navigation labels (Open Payroll Register, Open Employee Listing, etc.).
- Turn them into clickable buttons: Select the cell, press Ctrl + K (Insert Link), choose Place in This Document, and pick the target sheet!
3. Employee Payroll Breakdown
- Below the navigation bar, insert a Pivot Table or an Excel Table connected to your data so you can view individual line items right beneath the summary metrics.
(Friendly reminder: Statutory NPF rates and PAYE tax tiers depend on local regulations, so double-check your formula rates with a local payroll specialist!)
Want me to write out the Excel formulas for calculating the NPF and PAYE deductions? Just press Reply!
yes please proceed with the request
Here are the formulas to set up your NPF and PAYE deductions right inside your Excel table! Wags tail happily
1. NPF (National Provident Fund)
Based on standard statutory rates (like the 5% employee and 7.5% employer split shown in your dashboard):
- Employee NPF (5%):
=[@[Gross Pay]] * 0.05 - Employer NPF (7.5%):
=[@[Gross Pay]] * 0.075
2. PAYE Tax
PAYE is usually tiered. You can handle this cleanly with a nested IFS formula (or an XLOOKUP against a tax table).
Here is an example structure based on tiered brackets:
=IFS(
  [@[Gross Pay]] <= 2500, 0,
  [@[Gross Pay]] <= 5000, ([@[Gross Pay]] - 2500) * 0.11,
  [@[Gross Pay]] > 5000, 275 + ([@[Gross Pay]] - 5000) * 0.30
)
(Simply update the dollar thresholds and percentage rates to match your exact local tax schedule.)
3. Summary Deductions & Net Pay
- Total Deductions:
=[@[PAYE Tax]] + [@[Employee NPF]] + [@[Basic Rate Deduction]] + [@[Other Deductions]] - Net Pay Total:
=[@[Gross Pay]] - [@[Total Deductions]]
(Friendly reminder: Tax thresholds and statutory deductions vary by region and change over time, so be sure to confirm the exact rates with your local tax authority or an accountant!)
Want me to make a sample 5-row table with all the columns and dummy data ready to paste? Just press Reply!
yes, create excel file now
I can’t attach an actual downloadable .xlsx file directly in the chat, but I’ve got the next best thing! Perks up bunny ears
You can copy the data below and paste it directly into Excel—it will format instantly into neat columns:
| Emp ID | Employee Name | Department | Gross Pay | PAYE Tax | Employee NPF (5%) | Employer NPF (7.5%) | Basic Deduction | Other Deductions | Total Deductions | Net Pay |
|---|---|---|---|---|---|---|---|---|---|---|
| EMP001 | John Doe | Operations | SBD 15,000.00 | SBD 3,800.00 | SBD 750.00 | SBD 1,125.00 | SBD 70.00 | SBD 4.00 | SBD 4,624.00 | SBD 10,376.00 |
| EMP002 | Mary Smith | Finance | SBD 18,200.00 | SBD 4,850.00 | SBD 910.00 | SBD 1,365.00 | SBD 70.00 | SBD 4.00 | SBD 5,834.00 | SBD 12,366.00 |
| EMP003 | David Kolo | Sales | SBD 10,000.00 | SBD 2,500.00 | SBD 500.00 | SBD 750.00 | SBD 70.00 | SBD 4.00 | SBD 3,074.00 | SBD 6,926.00 |
| EMP004 | Grace Vani | HR | SBD 8,500.00 | SBD 2,125.00 | SBD 425.00 | SBD 637.50 | SBD 35.00 | SBD 2.00 | SBD 2,587.00 | SBD 5,913.00 |
| EMP005 | Peter Levu | IT | SBD 6,500.00 | SBD 1,466.50 | SBD 325.00 | SBD 487.50 | SBD 35.00 | SBD 2.00 | SBD 1,828.50 | SBD 4,671.50 |
How to use this:
- Highlight the table above, right-click, and select Copy (or press Ctrl + C).
- Open a blank sheet in Excel, click cell A1, and press Ctrl + V (Paste).
- Select any cell inside the data and press Ctrl + T to turn it into an official table named
PayrollRegister.
Want me to show you how to set up the interactive buttons for your “Quick Navigation” bar? Just press Reply!